How to Use the Investigations Feature in Spyderbat

Quick look at the causal graph in the process investigation section of the Spyderbat console, tips on how to add and remove data from the causal graph view and how to share Investigation permalinks.

Published: August 20, 2021

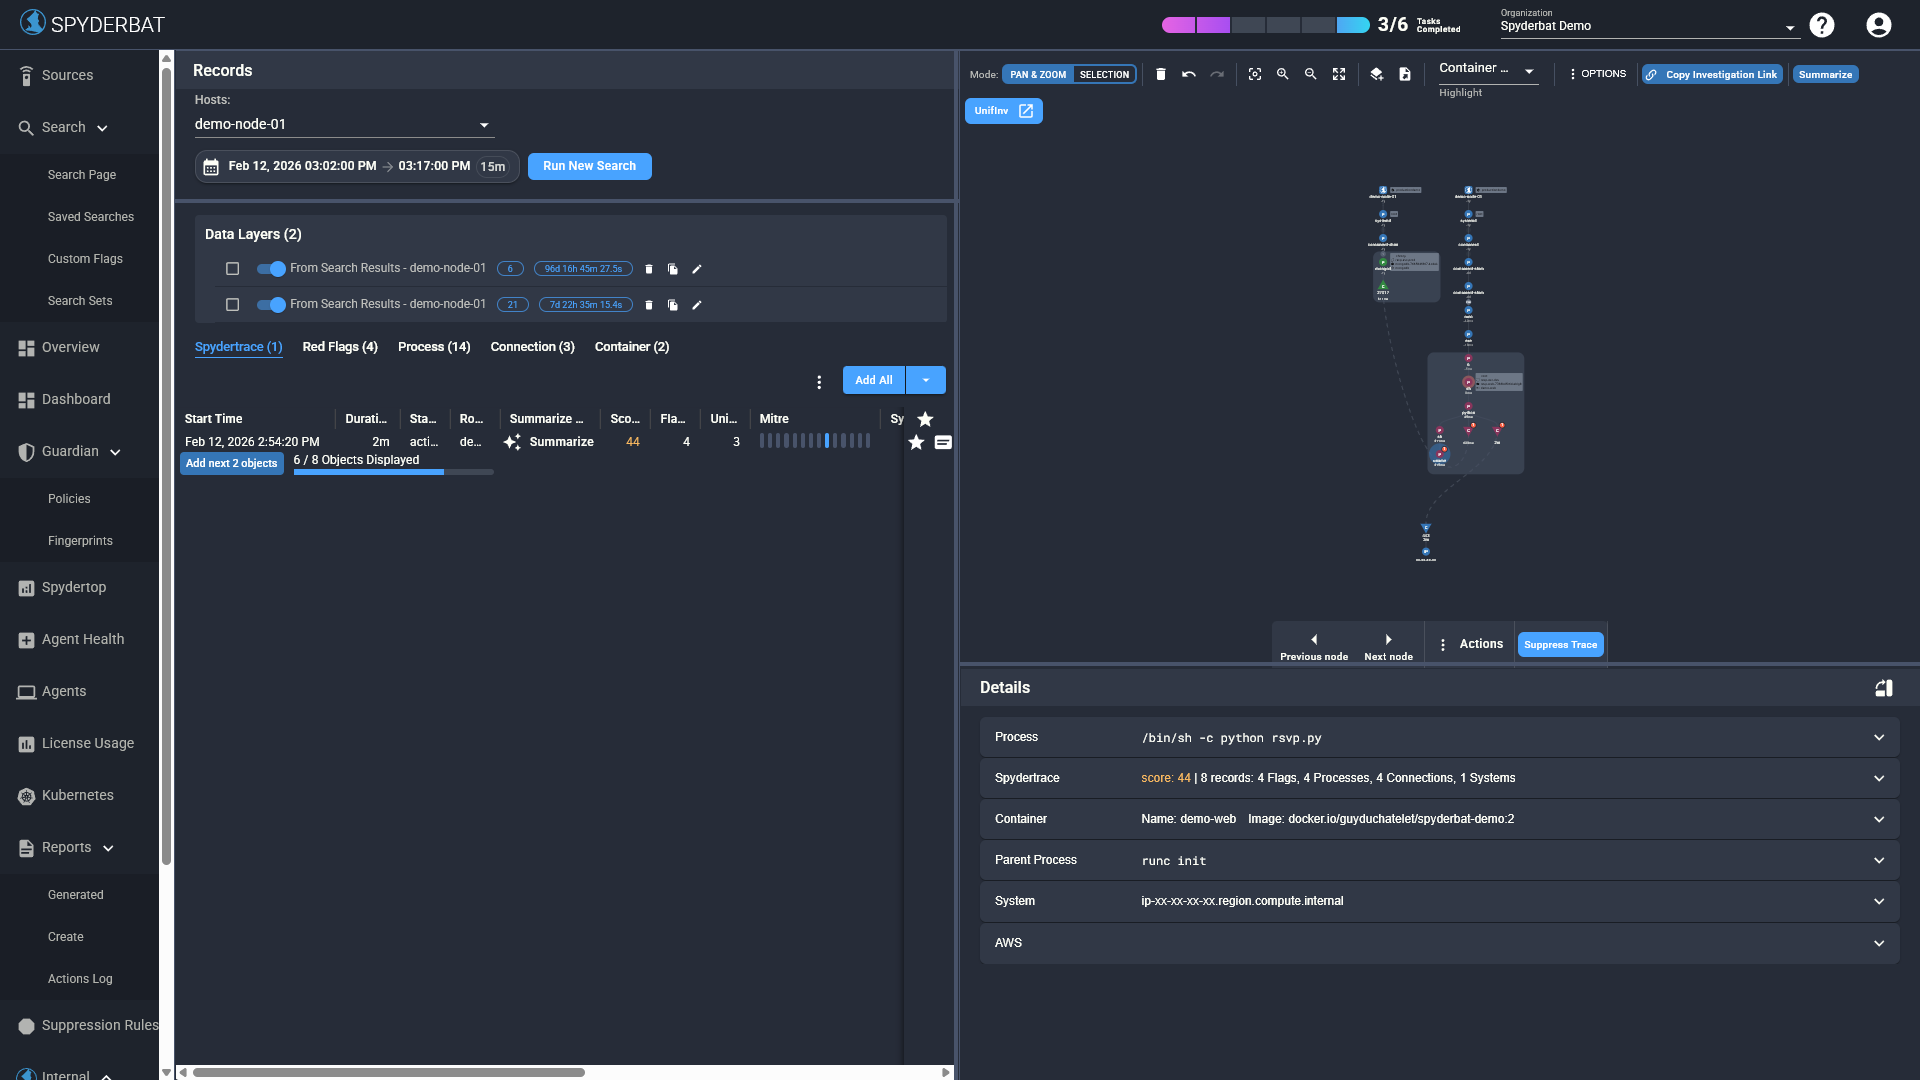
Any Record in Spyderbat investigated from a Search or Dashboard card can be viewed in the context of it’s Causal Tree. From within the Investigation section, click on the ‘star‘ to the right of any Record in the Records table.

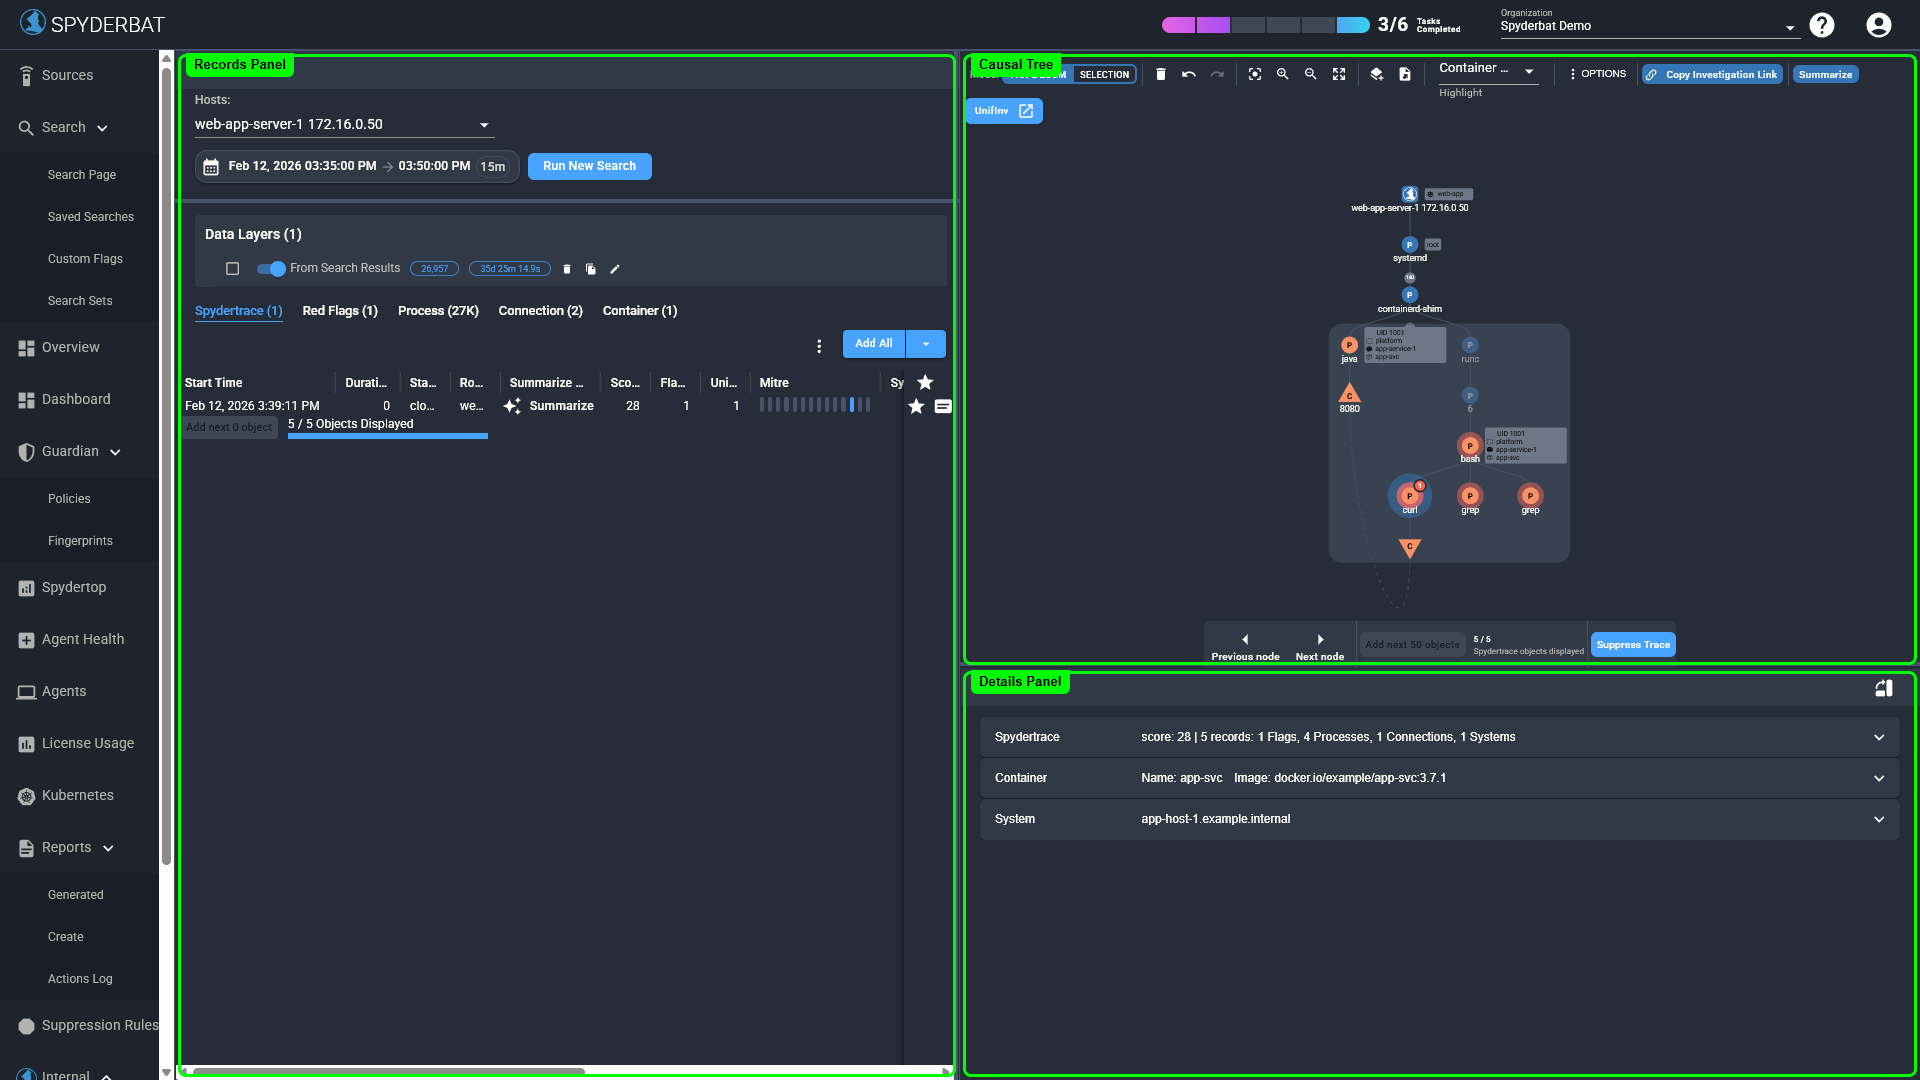
On the top of the Causal Tree, there are a number of options.

  • Clear the Causal Tree by clicking the trash can.

  • Use undo/redo actions actions to undo/redo actions performed in the Causal Tree (e.g. adding or removing nodes).

  • The next icon auto-focuses the view,

  • The magnifying glass icons zoom in or out of the Causal Tree, the same as using the scroll wheel on your mouse.

  • The “save to datalayer” button is extremely useful – it allows you to save whatever is displayed on the graph as its own datalayer or subset of records.

Enabling only that data layer (by disabling any others) allows you to explore only that data set in the Causal Tree and Records table. This can be used to view every process (or command that was executed) in both the tree and in a tabular format without any extraneous data. In addition, by focusing on only a Data Layer saved from the Causal Tree:

  • Use the “Previous Node” and “Next Node” buttons located at the bottom of the Causal Tree to cycle through the tree chronologically

  • Use the “Copy Investigate Link” button to share a very focused set of activity or the story of an attack with a colleague or for future reference.

A left-click selects a node. This displays more information about the node in the Details panel. It also highlights relevant records in the Records table tab.

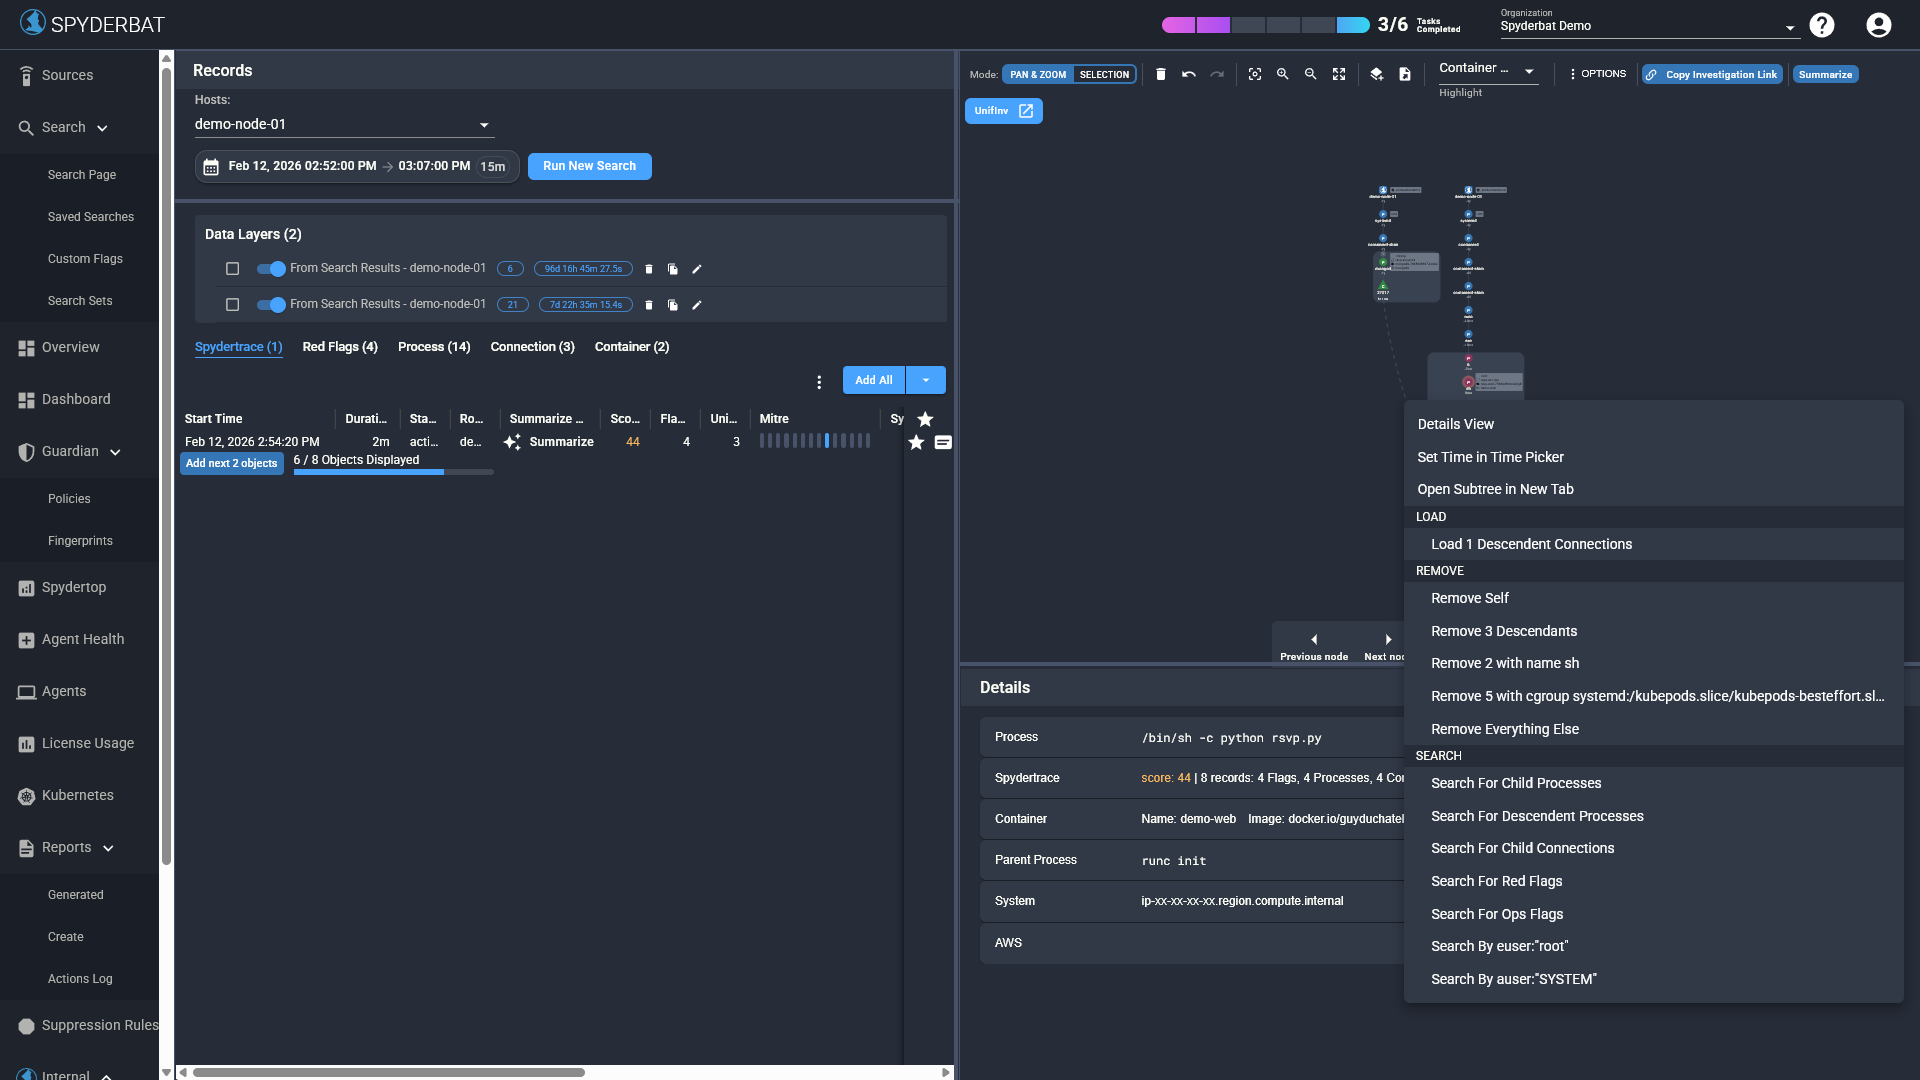
Right-clicking a node is very useful for both removing and adding additional items to the Causal Tree.

Removing nodes:

  • Selecting “remove self” is a handy way to remove a node and any dependent nodes, for example If by removing a bash process we remove all the child processes under bash.

  • Selecting “auto prune” removes all nodes that do not have a Flag or directly causally connected to a node with a Flag.

Adding nodes:

  • Children are directly connected to the selected node.

  • Descendants are every following node causally connected to the selected node.

  • Connections are any Network connections with a causal relationship to children or descendants.

The Causal Tree only displays records captured in the enabled Data Layers. What if there is activity outside the original query time frames of those Data Layers?

Loading Children or Descendants:

  • Selecting to load Children or Descendants via Search performs a search for other activity across all time known to Spyderbat and bring any activity we find in as another Data Layer

Lastly, we want to show you a powerful option for the Causal Tree under the options drop-down. Selecting “show relative time” displays a relative time on the Causal Tree for any selected node. For example, in the above screenshot the bash shell node is selected. We can see the relative time of when commands were performed in the bash shell. This is tremendously useful when viewing traces that span across time to visually understand the temporal distance between activities. In the above example, it is clear that the “whoami” command occurred 11 minutes after the previous commands.

Thank you and Happy Tracing!

Last updated

© SPYDERBAT, Inc., All Rights Reserved